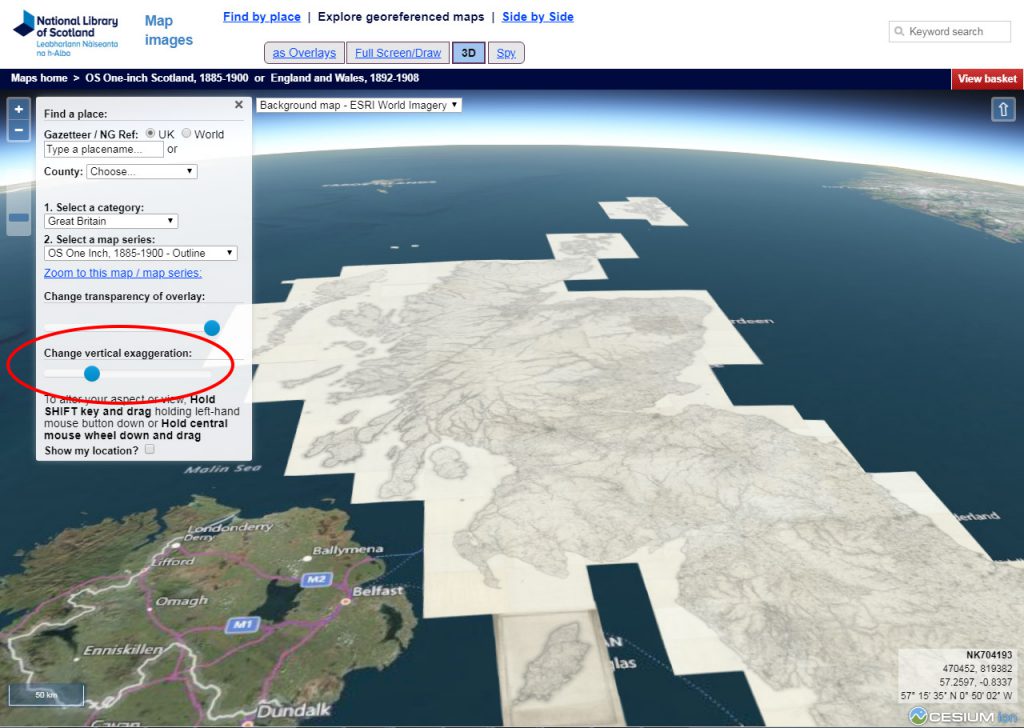
In early 2016 we launched our 3D map viewer, allowing our georeferenced maps to be viewed from a bird’s-eye perspective. This combines our historic map layers with elevation data, so that they can be draped and visualised across a real landscape in three dimensions.
Whilst the viewer has been popular, we have recently added a new ability to dynamically enhance the vertical exaggeration of relief. This allows more subtle variations in terrain and height differences to now be seen much more clearly.
This is best illustrated by looking at a few examples:
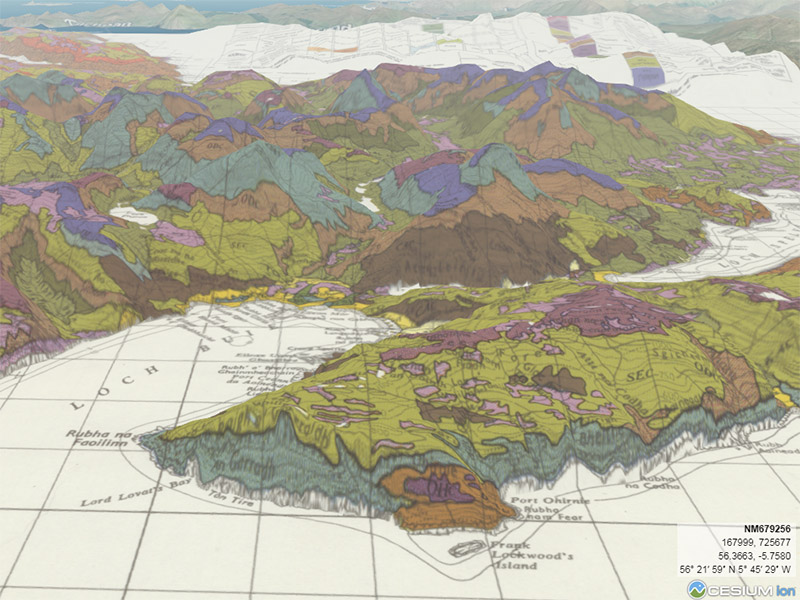
Soils and their spatial variation reflect slope and altitude, as illustrated in this striking visualisation of soil mapping on Mull:
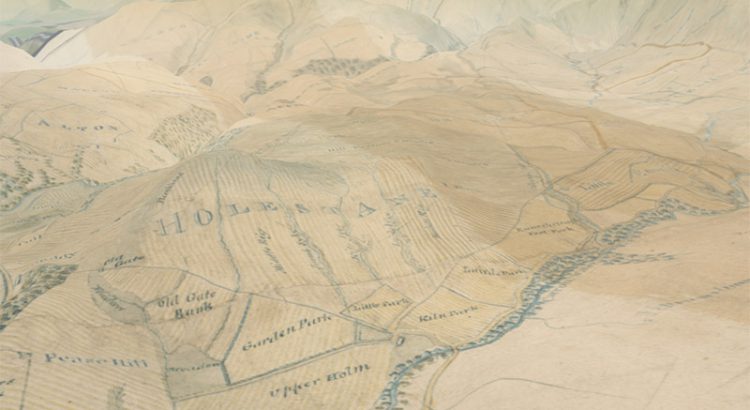
Estate maps from the mid-18th century onwards were often accurately surveyed, and can therefore be usefully draped over the landscape. Here you can imagine yourself in an 18th century helicopter, hovering over Drumlanrig in Dumfries-shire. Patterns of arable land and woodland were and are closely linked to slope and height.
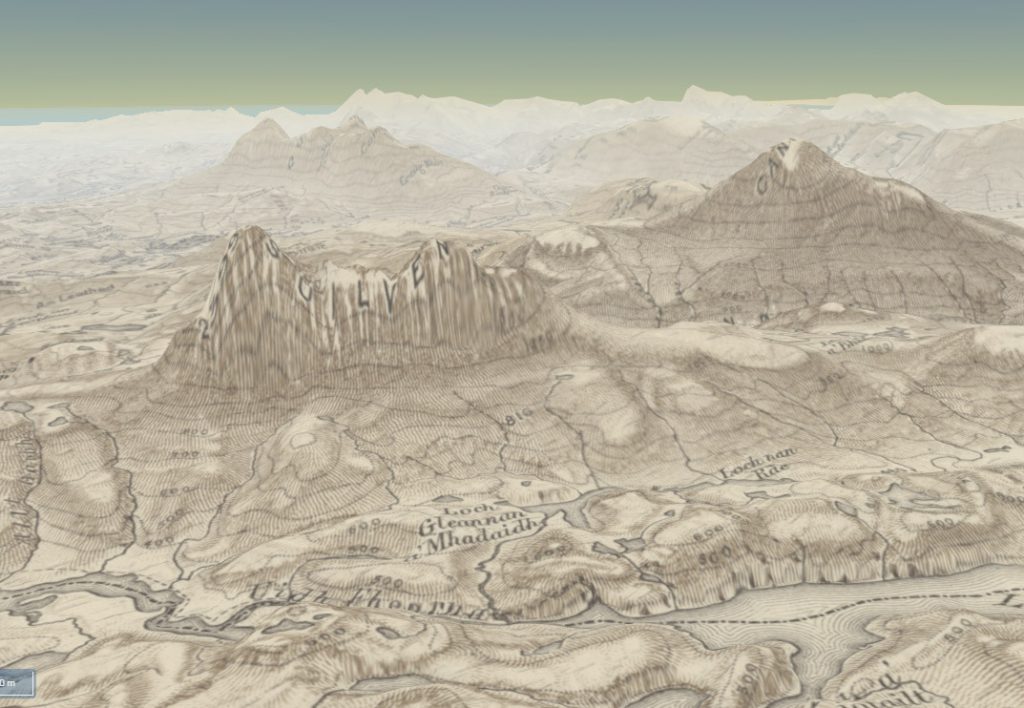
The standard practice of depicting relief in the 18th century was with hachures, lines with variable thickness with followed the direction of slope, and by combining the map with elevation data, the shape of the landscape can be seen more clearly. This example below focuses on the mountains of Suilven and Canisp in Assynt, with the Ordnance Survey’s one-inch “hills” edition (1885-1903), with brown hachures:
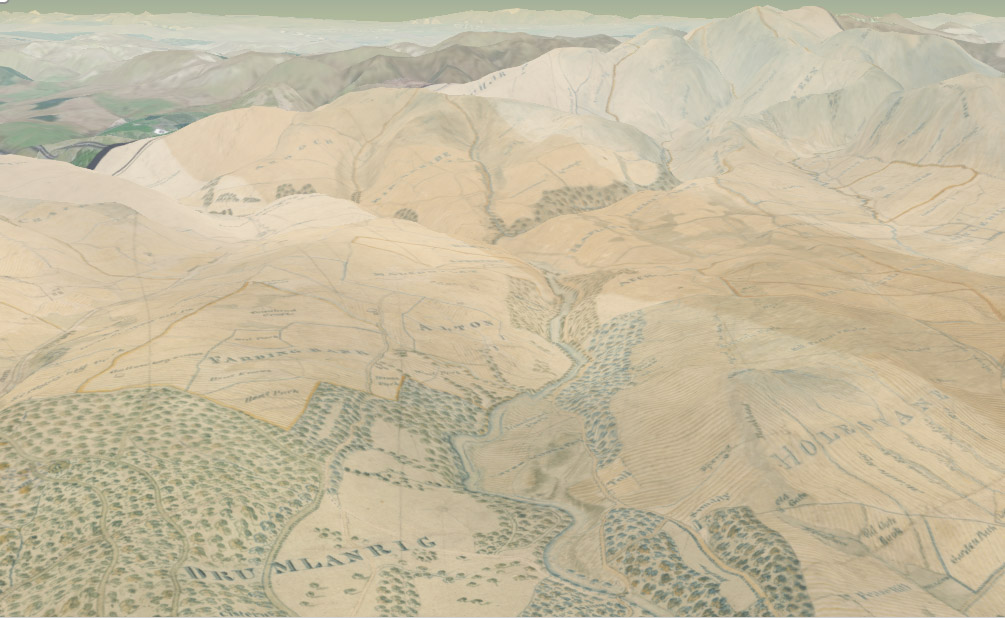
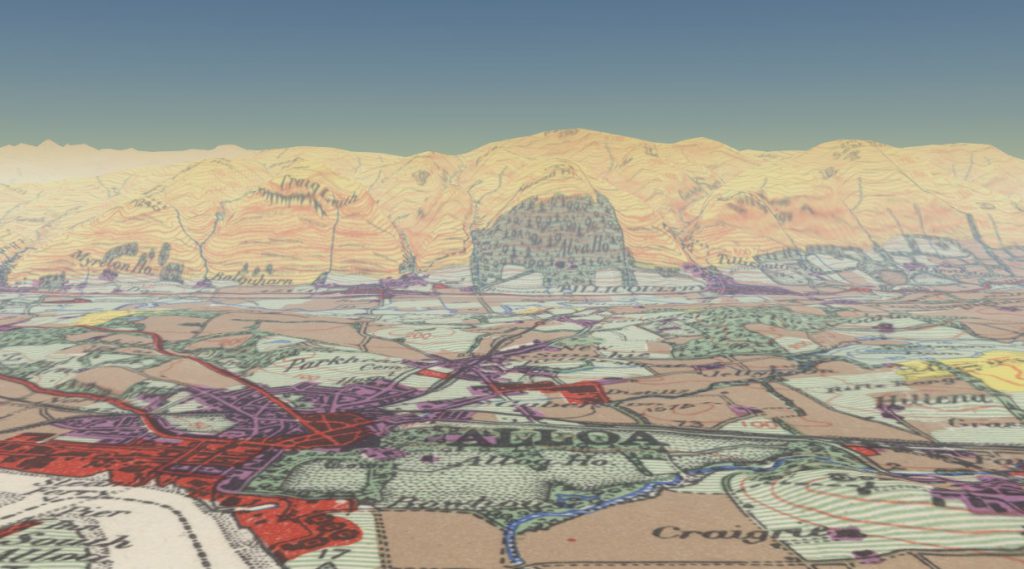
Land-utilisation maps are another category of mapping that can be enhanced through an understanding of relief. This view north of the Ochils from Allow shows the dramatic contrast between the flatter arable lands north of the Forth, and the hilly Ochils in the distance, coloured yellow to depict moorland.
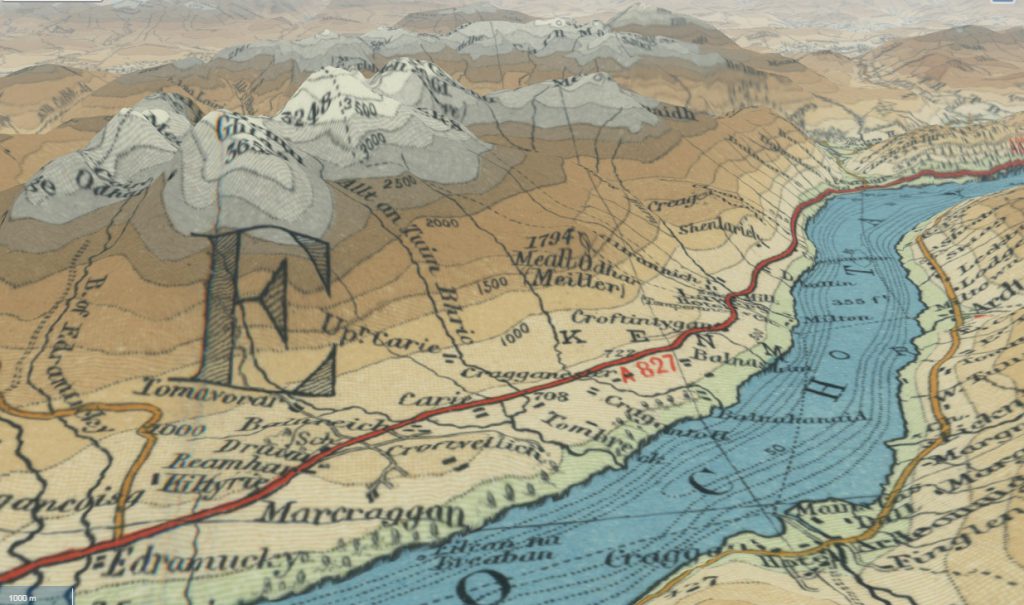
The Edinburgh mapmakers, John Bartholomew & Son were famous for their use of layer-colouring, employing a palette of colours from greens closer to sea level to browns and sometimes whites for mountains. This view below looks north-east along Loch Tay, with the dramatic outline of the Ben Lawers ridge to the north:
The default URL in the viewer is a permalink, including details of the height, tilt, bearing, latitude/longitude location and specific map, as well as the vertical exaggeration. This is hopefully useful for saving, sharing and promotion.
The 3D map viewer uses the open-source Cesium technology. Following our promotion of the 3D viewer, we were asked by the Cesium team to showcase it on their Cesium demos page. Details of our 3D historic map viewer are under Geospatial.
The 3D map viewer includes our standard interaction options, including a zoom slider, a scalebar, mouseposition location, as well as the ability to choose georeferenced overlays and background layers. Our standard map location options, such as geolocation, the ability to locate the map with placenames and drop-down lists of counties and parishes are all included.
The 3D map viewer uses open-source technology, which has been shared on Github and described with notes in the GeoCart Historical Maps Online Workshop.