Written by Rachel Dishington, Collaborative Doctoral Partnership PhD student at the University of Edinburgh
The Stevenson family of engineers worked extensively throughout Scotland during the nineteenth and early twentieth centuries. Their work focused primarily on coastal engineering projects, particularly harbours including at Peterhead as shown below. Most famously, they were responsible for the construction and maintenance of most of Scotland’s lighthouses, providing an essential service for shipping and fisheries and helping to make the sea safer for sailors and passengers travelling in Scottish waters.
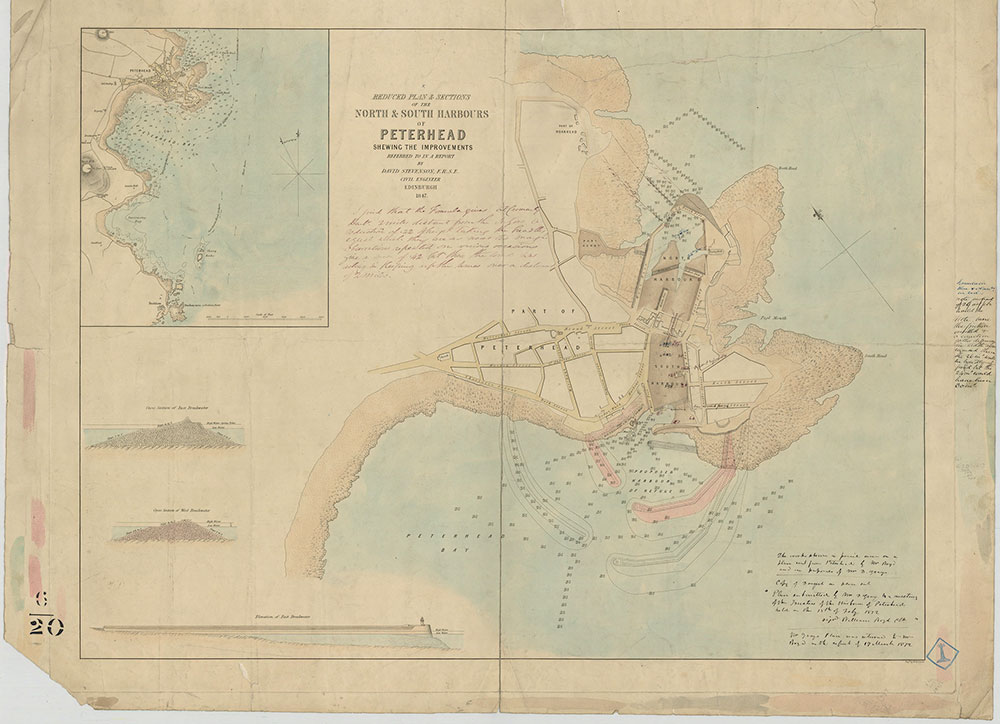
The business records of the Stevenson firm are held as part of the Library’s collections. This includes over 2000 maps, plans and diagrams relating to various engineering schemes undertaken in Scotland in the nineteenth century. This summer, as part of a PhD student development project at the Library, I have created a digital geographic finding aid that will indicate the locations that are shown in these maps, plans and diagrams. I hope that this will improve the accessibility of the Stevenson collection for researchers interested in the history of infrastructure and civil engineering in Scotland. I have described my workflow below in detail, in the hope that others may find it useful for geocoding other textual documents.
Phase One: Metadata
I began the project by combining and organising the data currently held about the Stevenson materials. At the beginning of the project, there were two separate inventories relating to the Stevenson maps, plans and diagrams, one relating to the original donation in the 1950s (MSS.5843-5896), and the second relating to a later purchase in the 1990s (Acc.10706). The two inventories were structured in different ways, with inconsistent ways of describing the location of the plans. My first task was to combine the two sets of information and make sure that the data was standardised. I did this by adding standard fields to every record, shown here in red.
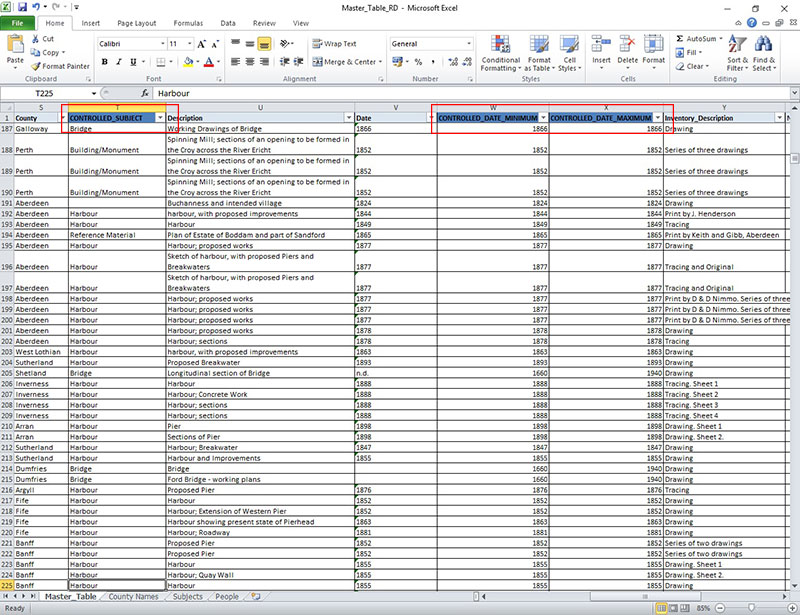
In particular, I tried to find a find a specific location for each item from the existing metadata. Some records already had this information so I could copy it over easily, but for others I had to work it out from other fields and then enter it myself.
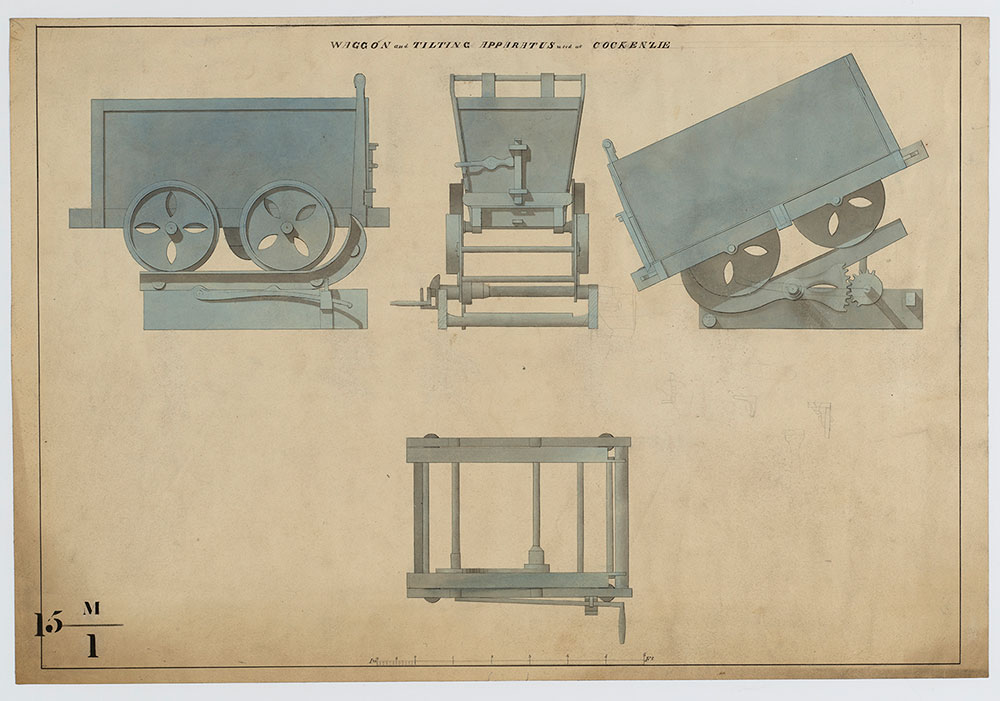
I also found around 135 plans that showed machines instead of places, for example this diagram of a waggon that was used on some of Scotland’s railways. I removed these records from the data and listed them separately because they couldn’t be located at a specific point on a map. These will have to be accessed in a different way when the content is put online so that users can still find out about them despite them not being displayed in the geographical interface.
Phase Two: Geocoding
Once I had standardised the data and had a list of places associated with the records in my spreadsheet, I used QGIS, freely available mapping software to create a digital map showing the locations of the Stevenson materials. Whilst there are a growing number of ways of geocoding, including the Edinburgh Geoparser, Recogito, and BatchGeo, I chose QGIS as it suited the structured data I already had, and it is a quick and simple workflow. The process that I followed is outlined below.
It is possible to customise what QGIS is able to do by adding plugins. For this project, I added the MMQGIS and QuickMaps plugins using the QGIS ‘Plugins’ button in the toolbar. Plugins add extra functions to QGIS and enable you to do more things with the software.
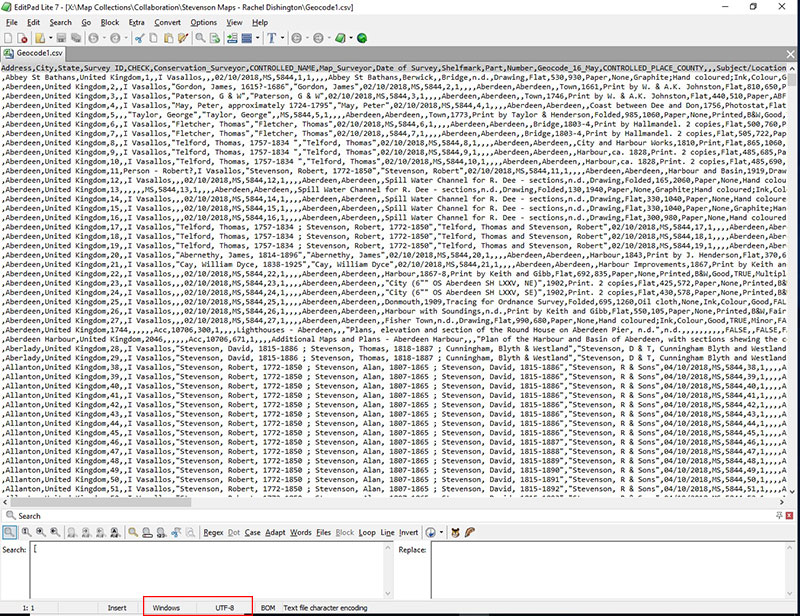
Excel files cannot be directly read by QGIS, so to import data from one to the other I needed to change the file format. I saved my spreadsheet data as a .csv file by using the ‘Save As’ function in Excel and finding ‘.csv’ in the drop down menu. Once I had saved the file as a .csv, I used EditPad – an OpenSource text editor – to change the character encoding to UTF-8. The file was now compatible with QGIS and ready to be geocoded.
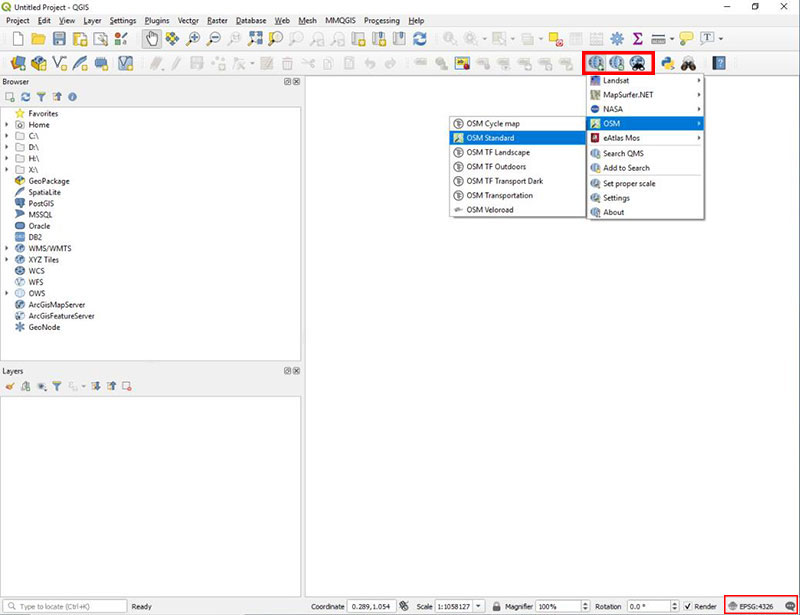
To add a map for reference, I used the QuickMapServices plugin to add the OSM Standard option. I changed the projection of the resulting map to EPSG:3857 – the standard for web maps – using the button outlined in red. QGIS tutorials provides further information on projection. My points and area location files were saved in EPSG:4326 – with latitude and longitude values held as degrees
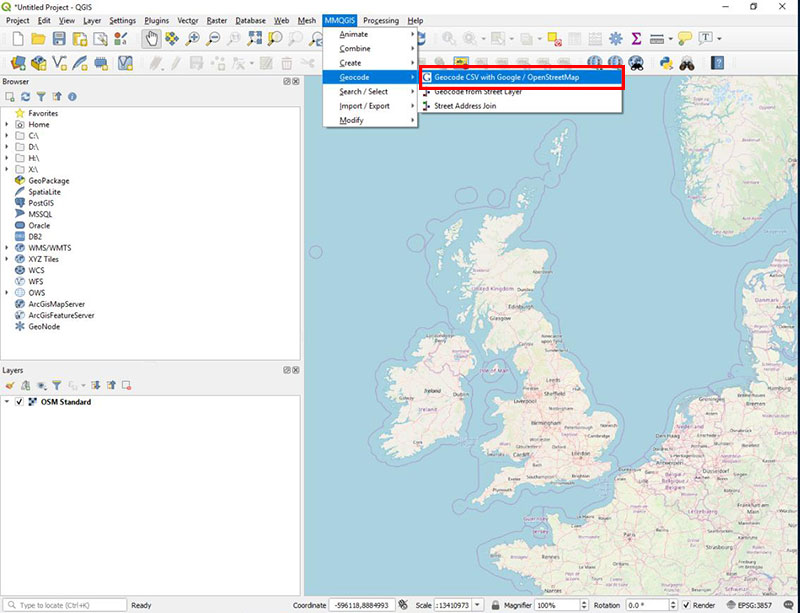
To find the locations of all of the places listed in the Stevenson inventory, I used the MMQGIS menu and selected the ‘Geocode’ function.
I selected the fields in my .csv file that contained geographical information about my data. In particular it looked for a county, town, street address and country. I included these data fields in my spreadsheet, and left them blank if they were not relevant for that engineering project. I was also able to use this screen to select a location for the geolocated file to be stored once complete.
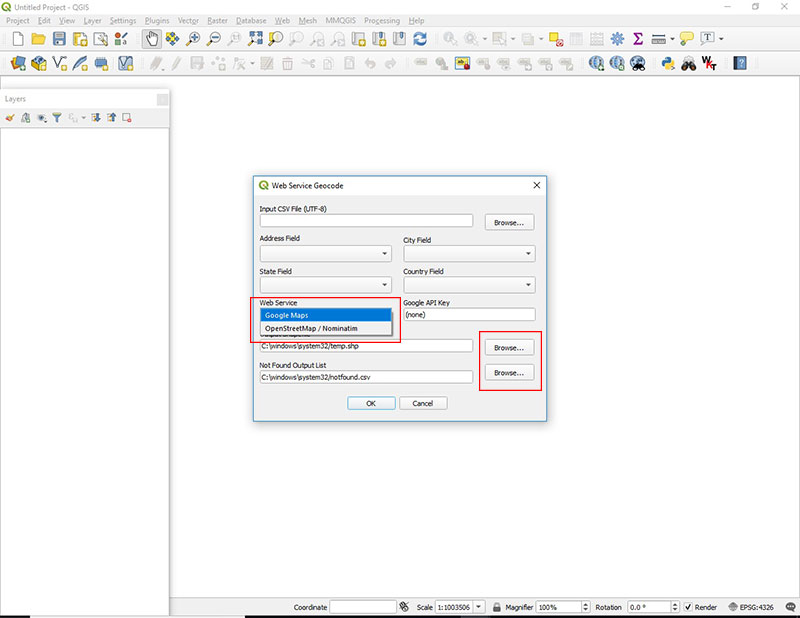
I also had to choose between using Google maps and OpenStreetMap gazetteers to geocode my data. OpenStreetMap is a free and open mapping resource generated by a community of users that is available for use by the public. Google maps provides similar functionality but is owned and maintained by Google. The gazetteers in both are good quality and detailed enough for my purposes. OpenStreetMap has an upper limit to the number of records that can be geocoded – I was not able to use it for the initial 1473 plans in the Stevenson collection that had easily defined locations. Google does not have an upper limit, but requires an API key (which can be relatively easily obtained) and has charges at higher levels of usage. The geocoding process can take some time – for me it took around ten minutes to complete 1473 locations.
I then manually checked any points that looked like they had been located incorrectly and altered them to the correct location by cross referencing with the georeferenced historic mapping on the maps website. I could then manually drag and drop those points to the correct location using the ‘Toggle edit’ feature in QGIS.
Once it has finished geocoding the points using Google maps or OpenStreetMap, MMQGIS generates a list of points that could not be located using this process. These points had to be individually located and then added manually to the layer using the ‘Add point’ feature.
Phase Three: Drawing Features
Although the geocoding process works well for maps of specific locations, some of the Stevenson plans covered much bigger areas, including for example surveys of rivers or railway lines. It was clear that a single point on a map wasn’t going to give a good idea of where those maps covered, so we had to add them to the interface in a different way.
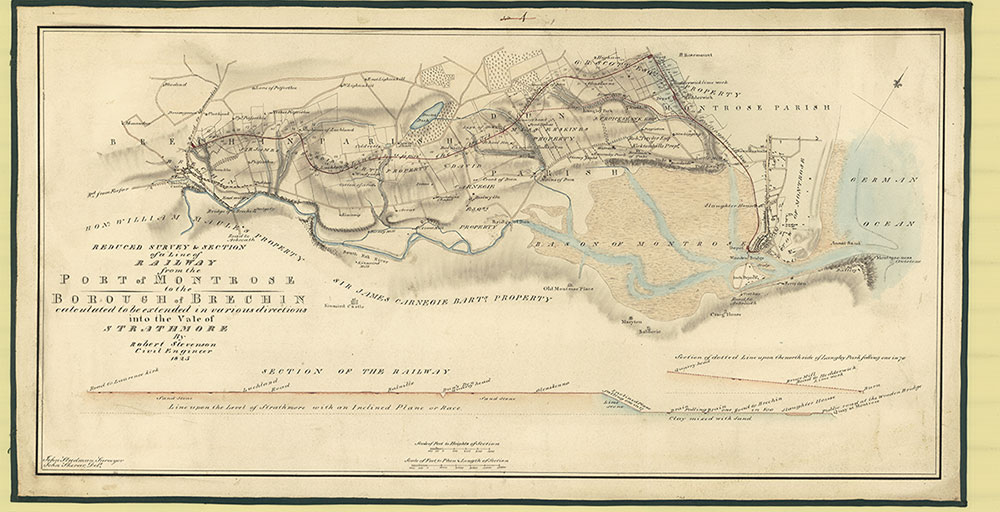
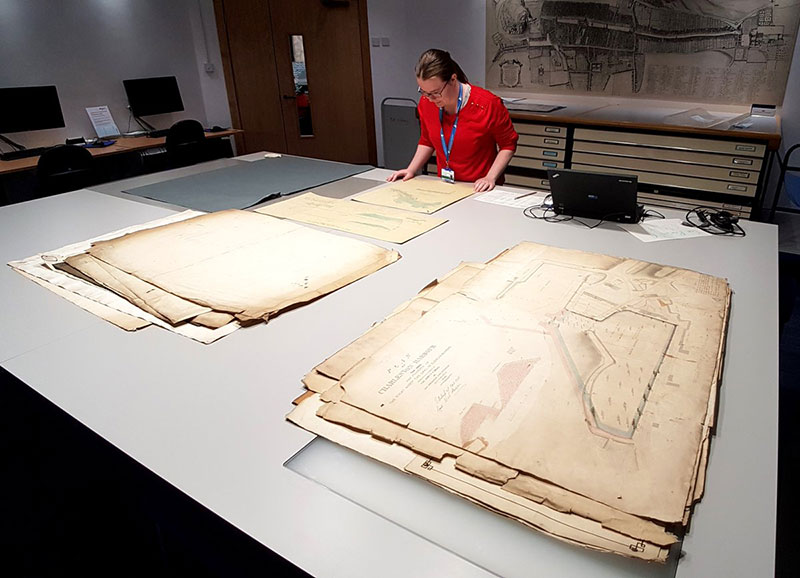
The first step in most cases was to consult the physical plans themselves and work out exactly where they showed. Some were clearly titled, but to find others I had to cross reference using the names of individual streets, buildings or landmarks. For some I didn’t have any written clues at all and had to match the shape of a river bend or bay.
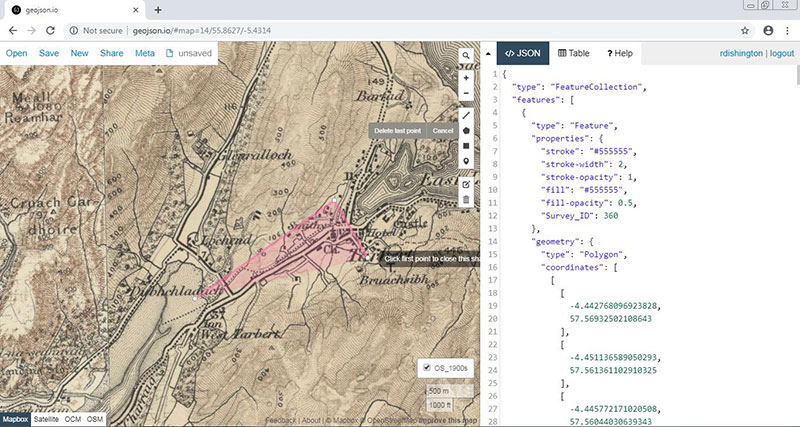
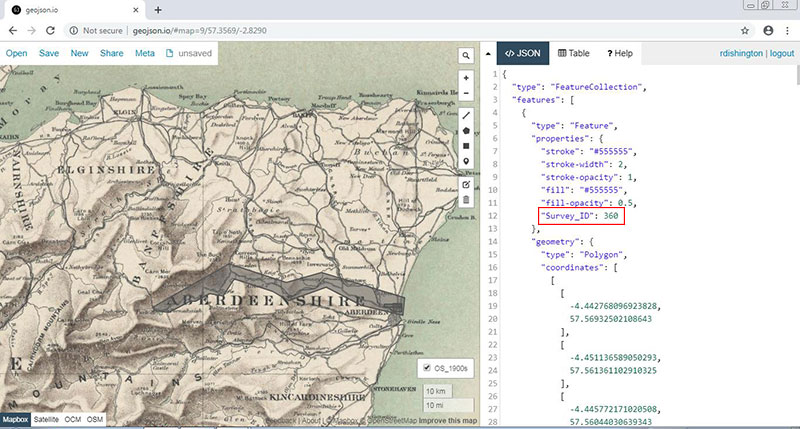
Once I had managed to identify the specific place shown in a plan, I used geojson.io to plot that area onto a digital map by clicking to create a box around that area. Although in theory I could have drawn the areas directly in QGIS, the consultation of the maps had to be done in the Maps Reading Room without access to QGIS, hence the reason for using geojson.io.
I imported historic map layers from the Library’s servers and used these in combination with the searchable online georeferenced maps to locate historic features or landmarks that corresponded with features on the Stevenson maps. This meant I could use historic Ordnance Survey mapping at different scales to locate plans of different sizes. For example, one plan of the River Conon showed a very small stretch of the river near Cononbridge that was only identifiable using the most detailed historical Ordnance Survey maps in the Library’s viewer.
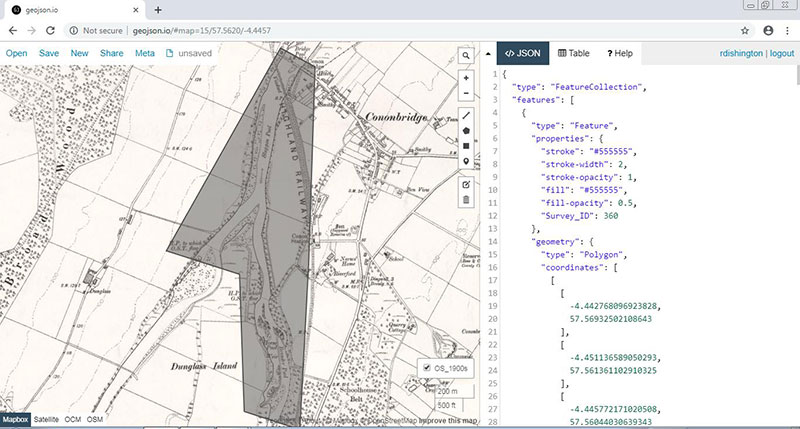
I was able to enter the unique numerical identifier for each plan directly into geojson.io to make sure that the shapes I was drawing would match up with the metadata in the main spreadsheet. This would allow me to import the metadata and attach it to the correct location on the digital map using the MMQGIS attributes join from csv function.
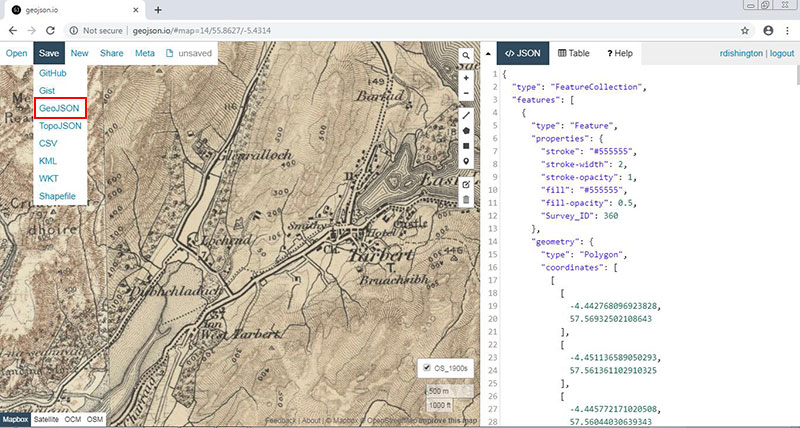
Once I had generated shapes for all of the plans, I exported what I had created as a .geojson file using the ‘Save’ menu on the website. QGIS is able to open .geojson files directly so this was an easy way to move the data from the website to my QGIS file.
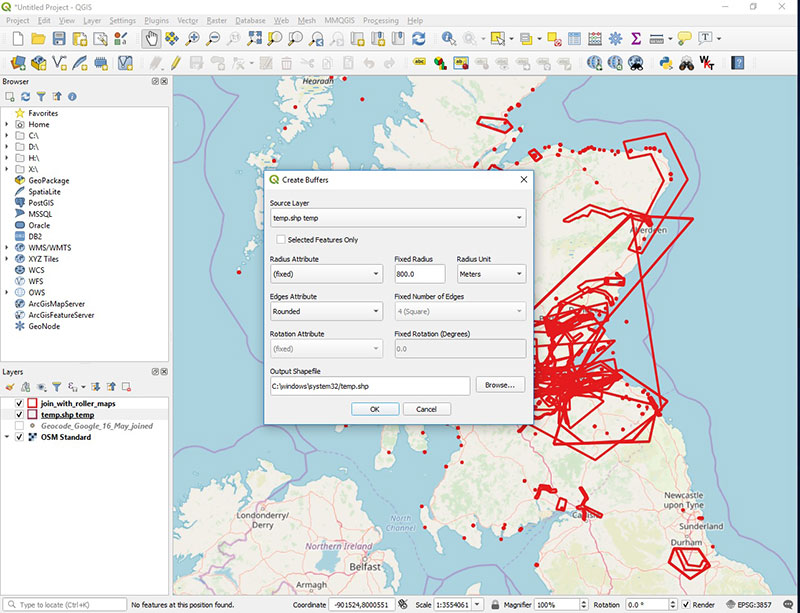
Once I had saved the bounding boxes as a .geojson file, I opened them in QGIS alongside my geolocated points. I used the MMQGIS buffer tool to convert the points into small squares around the specific location so that the different sorts of features would look the same and the point features would change size when I zoomed in and out like the shape features did.
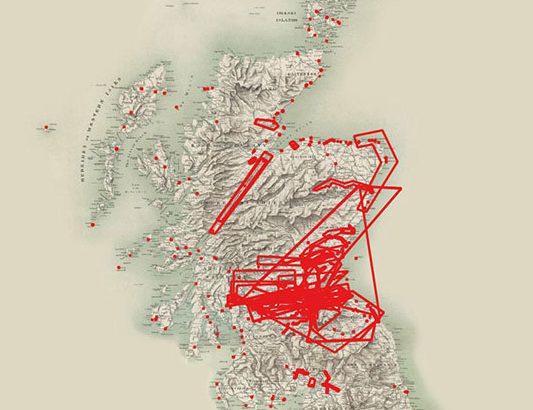
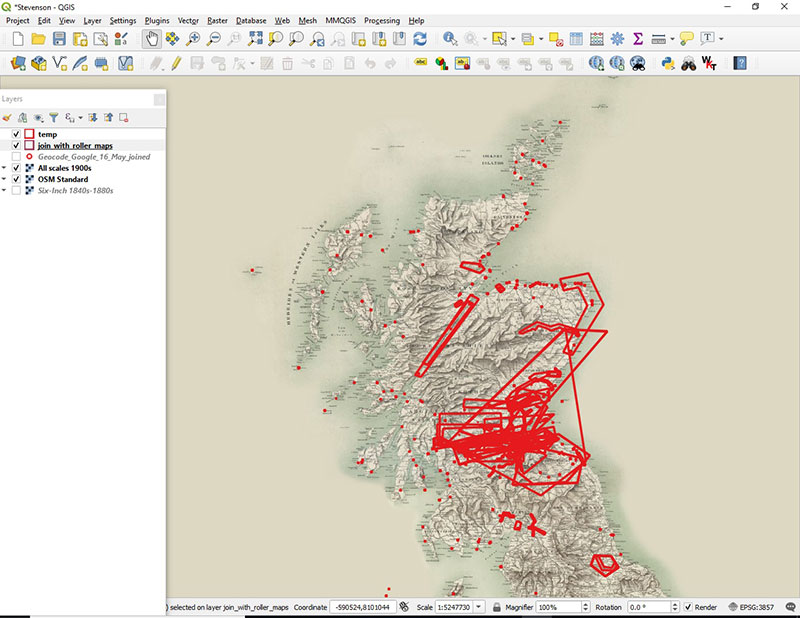
The finished result of the work was the generation of a set of shapes in QGIS that show the locations of all of the maps and plans that form part of the Stevenson collection, as can be seen here.
Now that I have generated this file, the next stage of my project is to add the metadata and design an interface to make the Stevenson collection easily searchable online. This will be taking place over the next month, so please do watch this space for updates on my progress.
