by Chris Fleet, Zekun Li, Katie McDonough, and Valeria Vitale.
Maps are excellent documentary sources for understanding the history of the landscape, including past human activities and former physical environments. Many organizations have scanned tens of thousands of historical maps and shared them online. For example, the Sanborn Fire Insurance Map Collection scanned by the Library of Congress shows detailed changes in the built environment of North American cities during the 19th and early 20th centuries. USGS topographic maps illustrate the past landscape of the whole of the United States during the 19th century. Meanwhile, on this side of the pond, the Ordnance Survey’s large-scale maps, many of which have been digitised by the National Library of Scotland, cover Great Britain from the 19th century to the present day, and provide a wealth of information for researching urban and rural built and natural environments as they change over time.
These map collections are so rich in detail as to be almost dizzying, and it is nearly unthinkable to analyse thousands of files without the aid of digital tools. But if we already seem to have more digitised maps than we can deal with, why would anyone want to fabricate even more of them? What would be the use of artificially generated maps, born digital maps whose design mimics the style of historical map sheets? The answer is: they can help us make the text embedded in these large historical map collections searchable.
Finding text on maps
Text printed on maps conveys a substantial part of a map’s content and meaning. Usually, text is placed close to the corresponding geographical features it relates to (e.g. roads, farms, or settlements). The different fonts and sizes of the text are useful for distinguishing between types of features, such as different kinds of administrative units. When working with thousands of maps at once, automatically finding these text labels and recognizing the text content is an essential step to unlock the information from map images and make them text searchable. Being able to work with text on maps as text, rather than as image, is significant to historians and others interested in the ways landscapes, and therefore cultures, are described.
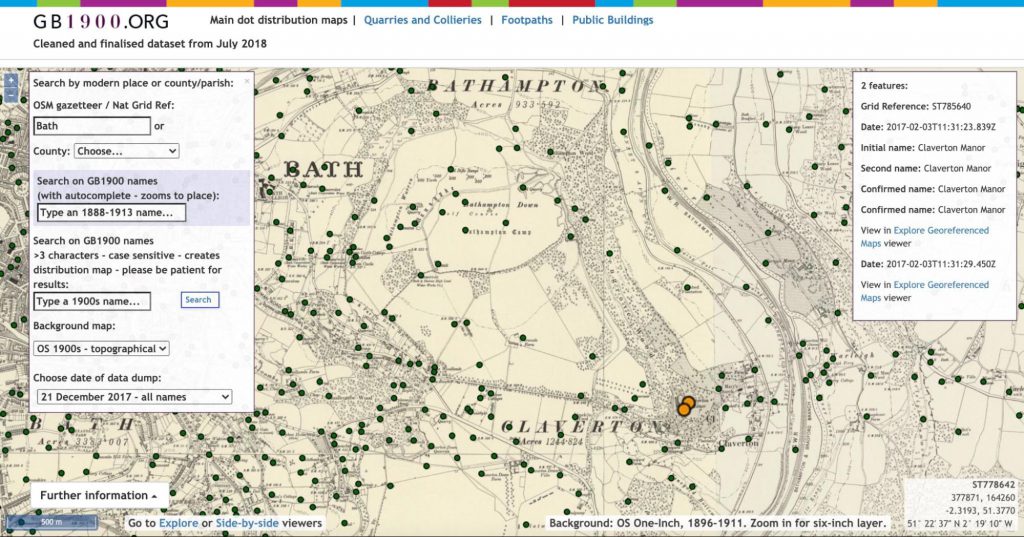
There have been successful projects which have collected text manually from maps. Collaborative online initiatives have achieved great results through crowdsourcing the work. For example, the GB1900 Project in 2017-18 gathered 2.5 million named features, from Ordnance Survey (OS) six-inch to the mile maps second edition map sheets (printed between 1888 and 1913). But, if people can do this, why would we want machines to replace them? One reason is that many institutions do not have the resources to run a long term crowdsourcing initiative. Synthetic maps are one piece of the puzzle for making the text on digitised map collections accessible to the public.
Machines Reading Maps
The Machines Reading Maps (MRM) project was started to create a suite of digital tools that address this challenge of finding text on maps. This collaboration between The Alan Turing Institute, the University of Southern California (USC), the University of Minnesota (UMN), and a group of national libraries holding some of the largest online map collections developed around one main idea: wouldn’t it be fantastic if we could automatically detect written words on maps and link that text to other knowledge, for example, a Wikidata record for an important, named building?
First, however, we had to fix one major problem: we needed to provide image-reading algorithms with lots of examples of text on different kinds of historical maps, in order for them to learn how to correctly detect, read, and link them. With some kinds of words on images with simple backgrounds, this is fairly straightforward. The machine is able to find the words, enclose them in bounding boxes, and process them. But with historical maps’ rich backgrounds, word placement often makes the text hard for a machine to read.
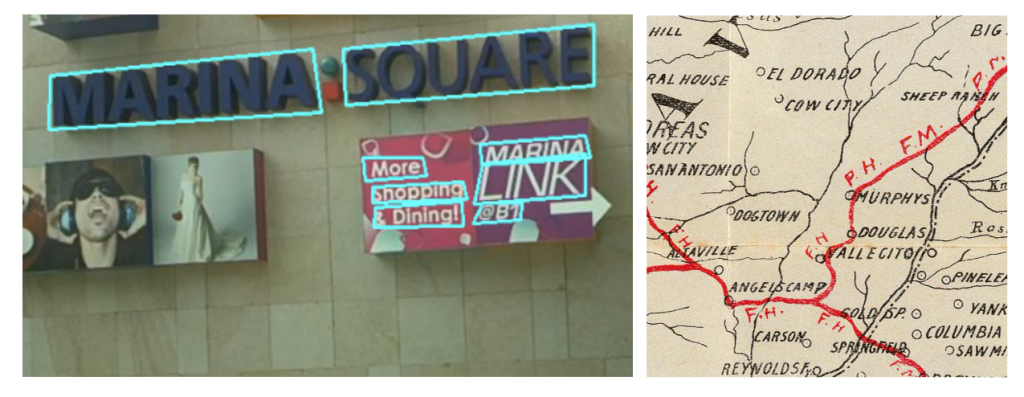
One way to deal with this issue would be to ask human readers to manually draw ‘bounding boxes’ around the text labels on the digitised historical maps, tell the machine what is actually written in that space, and what type of information it is (e.g. by adding a Wikidata link). In this way, the machine will have a set of information that experts have transcribed and selected (this is called “the gold standard”). A subset of this labeled data can be used to train the model and, hopefully, result in more accurate predictions.
We are using just such a process on Machines Reading Maps, thanks to the popular geo-annotation platform Recogito, but manual tasks take time, and are costly. We wanted to explore additional solutions, easily scalable to large collections, especially for libraries or individual researchers with small budgets: an efficient way to feed reliable information to the machine learning algorithm about what is written on historical maps.
This is where a member of the MRM team, Zekun Li, a PhD candidate in the Department of Computer Science and Engineering, University of Minnesota, came up with a brilliant strategy using the latest methods for creating synthetic data. It is not only effective, but also artful. Full disclosure: it involves a certain degree of falsification.
Creating a synthetic historic Ordnance Survey map layer
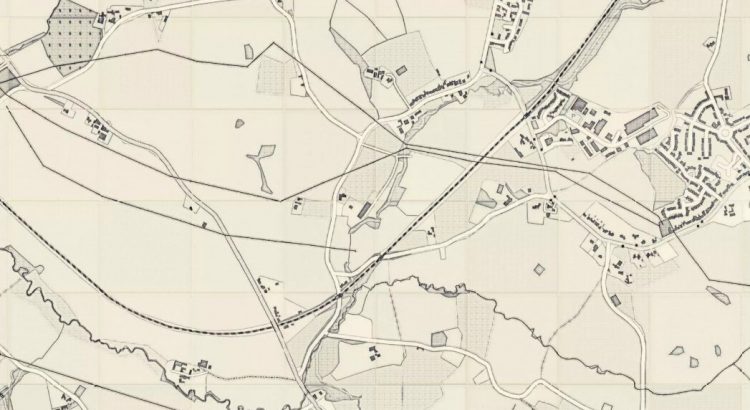
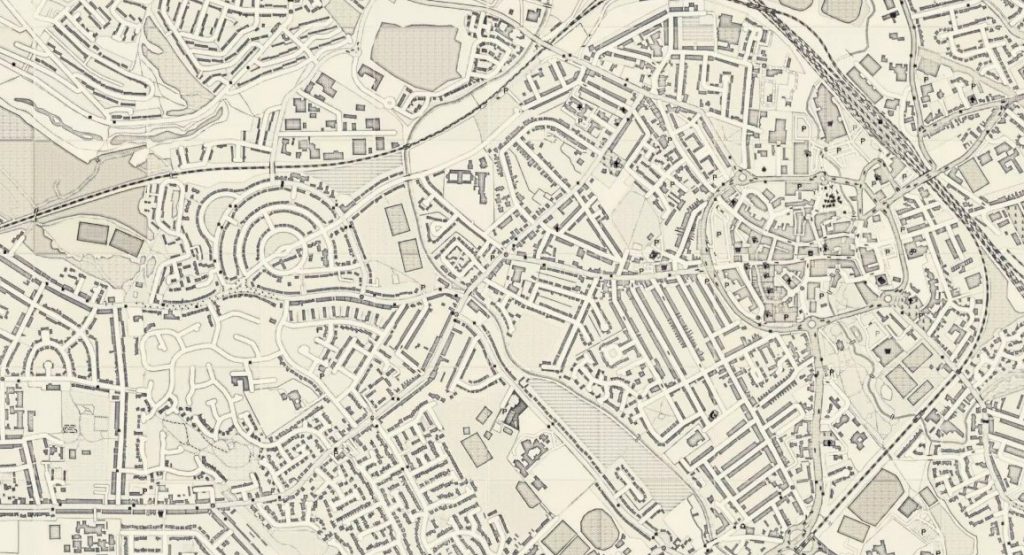
First, Zekun used an image transfer model called CycleGAN [1] to transform contemporary raster map images from OpenStreetMap (OSM) into map images that resemble the style of early OS maps. You can think of it as a “translation” of the image from its original style to another, recognisable one, i.e. the graphic of the OS maps. Or, if you prefer, you can think of an OSM map dressing up for a period costume party. What we achieve with this process is to create a map that never existed (or, more technically, a synthetic map): a map of a contemporary place that looks like a map from the Victorian period.
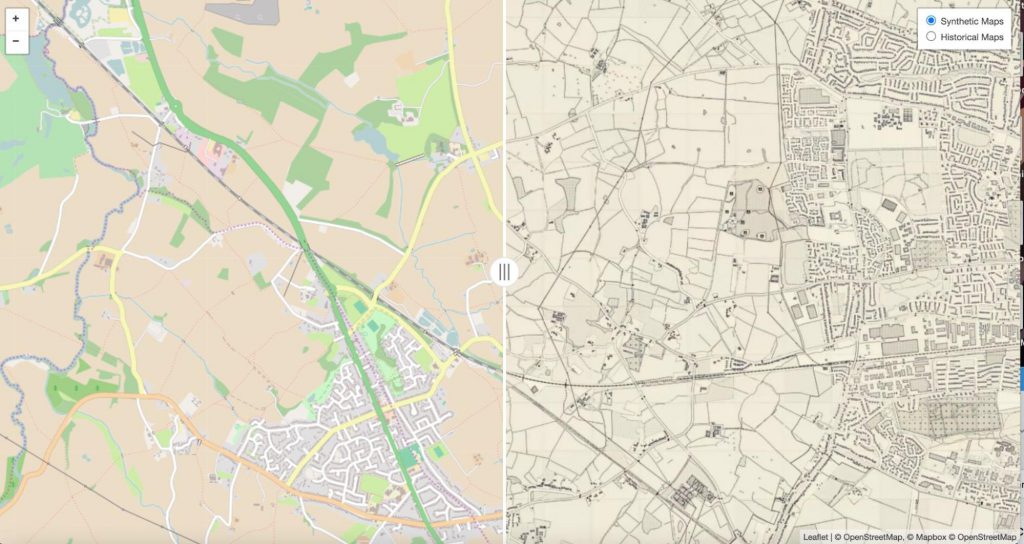
Contemporary map services like OSM have a fairly accurate idea of where places are and what they are called. Furthermore, that information is already in digital format. Thanks to the QGIS PAL API, Zekun was now able to populate our historical-looking maps with a layer of text labels. They are even roughly arranged on the map according to the general rules of the early OS maps: for point features (like the location of settlements), the API places the label near the point. For line features, like a river or a street, it places the label along the line.

Now we have a map with a (fabricated) historical background and 21st-century label information. This means that we can feed to a word detection model something that has visual challenges similar to those in the actual OS maps, but also reliable information about the text . For example, we know and trust
a) that the text accurately describes the entity on the ground,
b) the location of the text on the map, and
c) what type of entity the text refers to (building, street, county, town, etc.)
The algorithm will use this artificially clean data to learn how to “see” and “read” labels in similar contexts, and will produce more accurate guesses when trying to parse real historical maps. We are now several steps closer to our initial goal: making map collections easier to explore and query, for research or simply for fun.
Using synthetic data like this complements expert annotations. Together, they both improve the predictions that a model will make on new, previously unseen historical maps. The Deep neural networks (DNNs) we use on MRM are extremely powerful and could achieve much higher accuracy on various tasks compared with traditional machine learning approaches (e.g. text detection, classification, object segmentation etc). However, these deep-learning based models require a very large amount of data to train. To annotate enough training data with human experts would be extremely time intensive. With the workflow described above, we can generate an unlimited number of synthetic historical map images and text label annotations. So, we could have enough training data even to support the more computationally intensive DNN algorithms, like EAST [2] or PSENet [3] for text detection tasks, enabling automatic generation of map metadata [4].
This method can work with any graphic map style, as long as there is at least a small corpus on which the CycleGAN model can be trained. So, the possibilities are many! One could explore text on maps from 18th-century France, or collaborate with artists like Marion Carré, who has used artificial intelligence to “question the relationship to the real of the archive map”, or Martin Disley, both future or recent artists in residence at the NLS. We could even train the model on purely fictional maps, like those featured on fantasy books.
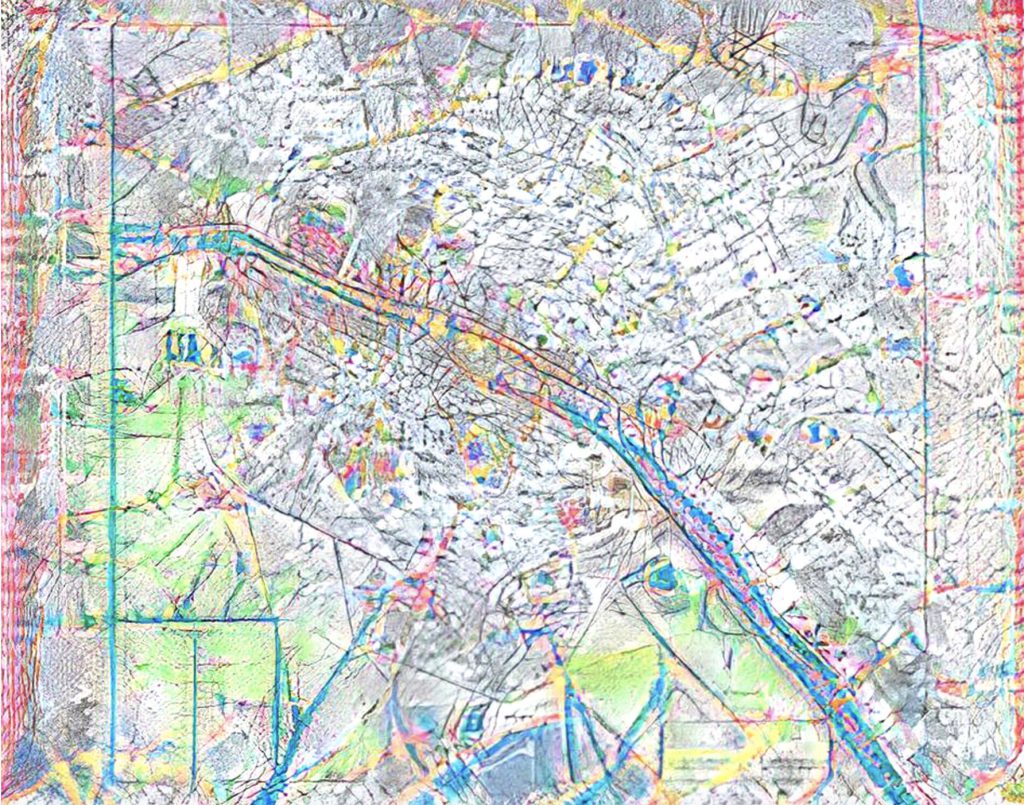
View the synthetic map and the code behind it
If you want to see the outcome of the map conversion, you can visit the online demo at https://zekun-li.github.io/side-by-side/. If you want to test the entire workflow, just roll up your sleeves: all you need can be found on this open repository: https://github.com/zekun-li/generate_synthetic_historical_maps.
Find out more
This is only a brief taste of some of the work Machines Reading Maps is carrying out in collaboration with the National Library of Scotland. Watch this space for updates in the next months! We are developing new tools and we will be looking for volunteers in the community of OS map lovers to try them out. If you want to know more about Machines Reading Maps, please read our project page. If you work with, or have an interest in, the OS maps, and you have a research question related to historical map labels that you want to discuss with us, feel free to get in touch anytime. You can also follow us on Twitter at @ReadingMaps.
About the Authors: Katie McDonough is the UK PI and Valeria Vitale is Research Associate on Machines Reading Maps at The Alan Turing Institute. Zekun Li is a PhD candidate in the Department of Computer Science and Engineering at the University of Minnesota. Chris Fleet is Map Curator at the National Library of Scotland.
References
[1] Zhu, Jun-Yan, et al. “Unpaired image-to-image translation using cycle-consistent adversarial networks.” Proceedings of the IEEE international conference on computer vision. 2017.
[2] Zhou, Xinyu, et al. “East: an efficient and accurate scene text detector.” Proceedings of the IEEE conference on Computer Vision and Pattern Recognition. 2017. View online.
[3] Wang, Wenhai, et al. “Shape robust text detection with progressive scale expansion network.” Proceedings of the IEEE/CVF Conference on Computer Vision and Pattern Recognition. 2019. View online.
[4] Li, Z., Chiang, Y.-Y., Tavakkol, S., Shbita, B., Uhl, J. H., Leyk, S., and Knoblock, C. A. (August 2020). An Automatic Approach for Generating Rich, Linked Geo-Metadata from Historical Map Images, In Proceedings of ACM Knowledge Discovery and Data Mining Conference (KDD), pp. 3290-3298, San Diego, CA, USA.
